

Rich State, Poor State
Do you live in a rich state or a poor state? And what are the best ways to determine which is which? Well, how about median household income? Which, by the very nature of it being the "median" means that half the households in that state earn more than that number, while half earn less.
But while this might be the best indicator of a state's rich/poor status (and the one that will determine its ranking on this list), we've also gone and added a number of other financial numbers in order to provide a fuller picture of the state's economic health (or lack thereof). And they are:
Households earning less than $10,000; Households earning over $200,000; Median earnings for workers; Unemployment rate; Families with income below poverty level; Households with health insurance
Where does your state rank on the list? (We'll also throw the District of Columbia in there as well)

51: Mississippi
Median household income: $48,716 (30.1% less than US median income)
Households earning less than $10,000: 105,133 (9.30%)
Households earning over $200,000: 40,061 (3.50%)
Median earnings for workers: $32,242 (men: $47,546; women: $37,056)
Unemployment rate: 6.40%
Families with income below poverty level: 14.40%
Households with health insurance: 88.10%
 CHUCK KELLY, CC BY-SA 2.0, Wikimedia Commons
50: West Virginia
Median household income: $51,248 (26.5% less than US median income)
Households earning less than $10,000: 60,933 (8.40%)
Households earning over $200,000: 31,442 (4.40%)
Median earnings for workers: $33,739 (men: $51,981; women: $39,897)
Unemployment rate: 6.20%
Families with income below poverty level: 12.30%
Households with health insurance: 93.90%
 Kevin Smith, Wikimedia Commons
49: Louisiana
Median household income: $52,087 (25.3% less than US median income)
Households earning less than $10,000: 164,981 (9.20%)
Households earning over $200,000: 101,388 (5.70%)
Median earnings for workers: $34,896 (men: $55,078; women: $40,136)
Unemployment rate: 7.60%
Families with income below poverty level: 15.20%
Households with health insurance: 92.40%
 thepipe26, CC BY 2.0, Wikimedia Commons
48: Arkansas
Median household income: $52,528 (24.7% less than US median income)
Households earning less than $10,000: 89,818 (7.60%)
Households earning over $200,000: 55,972 (4.70%)
Median earnings for workers: $33,869 (men: $47,329; women: $39,526)
Unemployment rate: 5.50%
Families with income below poverty level: 11.60%
Households with health insurance: 90.80%
 Brandonrush, CC BY-SA 4.0, Wikimedia Commons
47: Alabama
Median household income: $53,913 (22.7% less than US median income)
Households earning less than $10,000: 152,450 (7.70%)
Households earning over $200,000: 101,831 (5.20%)
Median earnings for workers: $34,925 (men: $52,177; women: $39,338)
Unemployment rate: 5.30%
Families with income below poverty level: 11.70%
Households with health insurance: 90.10%
 Carol M. Highsmith, Wikimedia Commons
46: New Mexico
Median household income: $53,992 (22.6% less than US median income)
Households earning less than $10,000: 75,083 (9.00%)
Households earning over $200,000: 48,458 (5.80%)
Median earnings for workers: $34,133 (men: $51,149; women: $43,227)
Unemployment rate: 7.80%
Families with income below poverty level: 14.30%
Households with health insurance: 90.00%
 Bowie Snodgrass, CC BY 2.0, Wikimedia Commons
45: Kentucky
Median household income: $55,573 (20.3% less than US median income)
Households earning less than $10,000: 144,592 (8.10%)
Households earning over $200,000: 92,250 (5.20%)
Median earnings for workers: $34,928 (men: $51,842; women: $40,991)
Unemployment rate: 5.40%
Families with income below poverty level: 12.20%
Households with health insurance: 94.30%
 OPMaster, CC BY-SA 3.0, Wikimedia Commons
44: Oklahoma
Median household income: $55,826 (19.9% less than US median income)
Households earning less than $10,000: 105,917 (6.80%)
Households earning over $200,000: 77,228 (5.00%)
Median earnings for workers: $34,460 (men: $51,289; women: $39,781)
Unemployment rate: 5.90%
Families with income below poverty level: 11.50%
Households with health insurance: 86.20%
 Jordan Michael Winn, Wikimedia Commons
43: South Carolina
Median household income: $59,318 (14.9% less than US median income)
Households earning less than $10,000: 144,668 (7.10%)
Households earning over $200,000: 122,320 (6.00%)
Median earnings for workers: $35,987 (men: $52,296; women: $40,739)
Unemployment rate: 5.60%
Families with income below poverty level: 10.80%
Households with health insurance: 90.00%
 John Rutledge Smith, Wikimedia Commons
42: Tennessee
Median household income: $59,695 (14.4% less than US median income)
Households earning less than $10,000: 181,576 (6.60%)
Households earning over $200,000: 175,898 (6.30%)
Median earnings for workers: $36,663 (men: $51,538; women: $41,863)
Unemployment rate: 5.30%
Families with income below poverty level: 9.70%
Households with health insurance: 90.00%
 Nathan C. Fortner, CC BY-SA 3.0, Wikimedia Commons
41: Missouri
Median household income: $61,847 (11.3% less than US median income)
Households earning less than $10,000: 146,475 (5.90%)
Households earning over $200,000: 157,589 (6.40%)
Median earnings for workers: $37,083 (men: $54,140; women: $43,065)
Unemployment rate: 4.60%
Families with income below poverty level: 8.40%
Households with health insurance: 90.60%
 Jason Doss, CC BY 2.0, Wikimedia Commons
40: North Carolina
Median household income: $61,972 (11.1% less than US median income)
Households earning less than $10,000: 265,655 (6.40%)
Households earning over $200,000: 308,936 (7.40%)
Median earnings for workers: $37,218 (men: $52,421; women: $44,297)
Unemployment rate: 5.80%
Families with income below poverty level: 9.40%
Households with health insurance: 89.60%
 Discover Durham, CC BY 4.0, Wikimedia Commons
39: Ohio
Median household income: $62,262 (10.7% less than US median income)
Households earning less than $10,000: 317,928 (6.60%)
Households earning over $200,000: 312,314 (6.50%)
Median earnings for workers: $38,214 (men: $57,177; women: $46,068)
Unemployment rate: 5.40%
Families with income below poverty level: 9.40%
Households with health insurance: 93.50%
 Paul Wasneski, Wikimedia Commons
38: Indiana
Median household income: $62,743 (10.0% less than US median income)
Households earning less than $10,000: 151,979 (5.70%)
Households earning over $200,000: 152,761 (5.70%)
Median earnings for workers: $37,998 (men: $55,191; women: $43,215)
Unemployment rate: 4.70%
Families with income below poverty level: 8.30%
Households with health insurance: 92.50%

37: Florida
Median household income: $63,062 (9.5% less than US median income)
Households earning less than $10,000: 542,819 (6.30%)
Households earning over $200,000: 663,997 (7.80%)
Median earnings for workers: $35,997 (men: $51,151; women: $42,228)
Unemployment rate: 5.60%
Families with income below poverty level: 9.40%
Households with health insurance: 87.90%
 Massimo Catarinella, CC BY-SA 3.0, Wikimedia Commons
36: Montana
Median household income: $63,249 (9.3% less than US median income)
Households earning less than $10,000: 23,195 (5.20%)
Households earning over $200,000: 30,784 (6.90%)
Median earnings for workers: $35,272 (men: $55,496; women: $41,725)
Unemployment rate: 4.00%
Families with income below poverty level: 7.20%
Households with health insurance: 91.80%
 Ken Eckert, CC BY-SA 4.0, Wikimedia Commons
35: Michigan
Median household income: $63,498 (8.9% less than US median income)
Households earning less than $10,000: 256,830 (6.30%)
Households earning over $200,000: 273,320 (6.70%)
Median earnings for workers: $37,258 (men: $60,293; women: $46,914)
Unemployment rate: 6.90%
Families with income below poverty level: 9.00%
Households with health insurance: 95.00%
 BenHerrera1979, CC BY-SA 4.0, Wikimedia Commons
34: Kansas
Median household income: $64,124 (8.0% less than US median income)
Households earning less than $10,000: 65,819 (5.70%)
Households earning over $200,000: 74,933 (6.50%)
Median earnings for workers: $38,071 (men: $54,902; women: $44,368)
Unemployment rate: 4.40%
Families with income below poverty level: 8.00%
Households with health insurance: 90.80%
 Ian Ballinger, CC BY-SA 4.0, Wikimedia Commons
33: Maine
Median household income: $64,767 (7.1% less than US median income)
Households earning less than $10,000: 32,174 (5.40%)
Households earning over $200,000: 39,832 (6.70%)
Median earnings for workers: $39,725 (men: $57,009; women: $47,018)
Unemployment rate: 4.90%
Families with income below poverty level: 7.20%
Households with health insurance: 94.30%
 Slashinme, CC BY-SA 3.0, Wikimedia Commons
32: Wyoming
Median household income: $65,204 (6.5% less than US median income)
Households earning less than $10,000: 14,659 (6.00%)
Households earning over $200,000: 14,179 (5.80%)
Median earnings for workers: $35,613 (men: $59,853; women: $40,976)
Unemployment rate: 3.70%
Families with income below poverty level: 7.80%
Households with health insurance: 87.80%
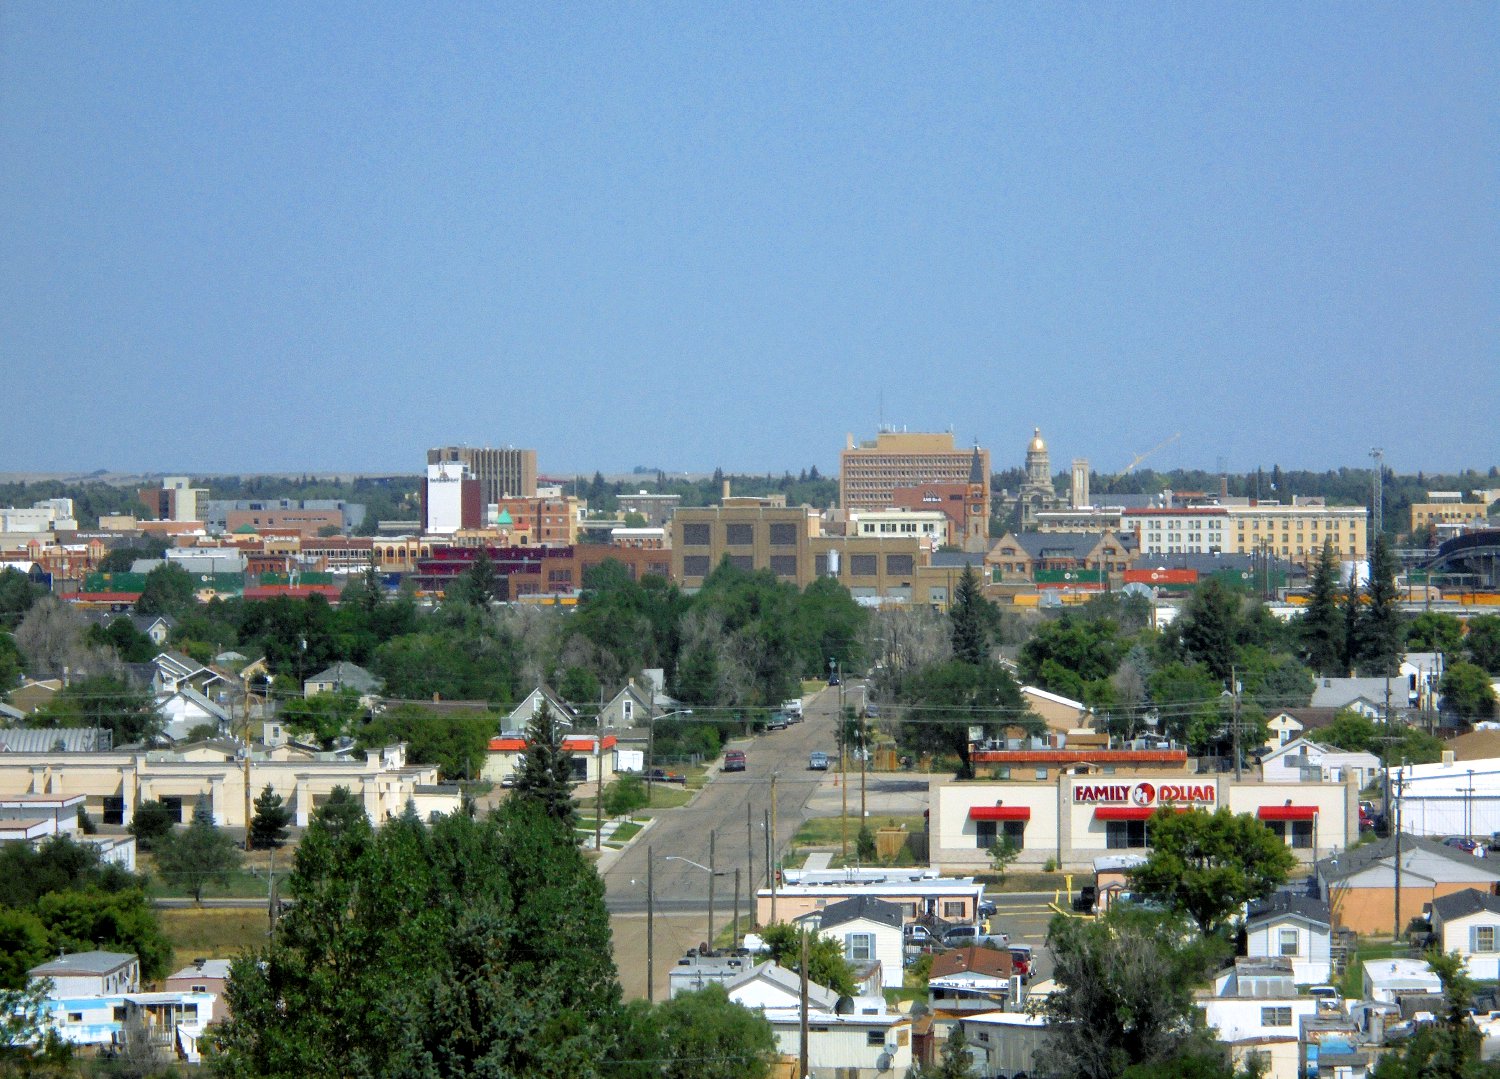 Vasiliymeshko, CC BY-SA 4.0, Wikimedia Commons
31: Iowa
Median household income: $65,600 (5.9% less than US median income)
Households earning less than $10,000: 64,244 (4.90%)
Households earning over $200,000: 81,020 (6.20%)
Median earnings for workers: $39,068 (men: $56,427; women: $44,801)
Unemployment rate: 3.60%
Families with income below poverty level: 6.90%
Households with health insurance: 95.20%
 Tim Kiser, CC BY-SA 2.5, Wikimedia Commons
30: South Dakota
Median household income: $66,143 (5.1% less than US median income)
Households earning less than $10,000: 17,158 (4.80%)
Households earning over $200,000: 20,292 (5.70%)
Median earnings for workers: $37,149 (men: $52,405; women: $41,792)
Unemployment rate: 2.80%
Families with income below poverty level: 7.90%
Households with health insurance: 90.50%
 Jake DeGroot, CC BY-SA 3.0, Wikimedia Commons
29: Nevada
Median household income: $66,274 (4.9% less than US median income)
Households earning less than $10,000: 85,960 (7.20%)
Households earning over $200,000: 89,881 (7.50%)
Median earnings for workers: $37,052 (men: $52,398; women: $44,906)
Unemployment rate: 9.70%
Families with income below poverty level: 10.60%
Households with health insurance: 88.40%
 Ken Lund, CC BY-SA 2.0, Wikimedia Commons
28: Idaho
Median household income: $66,474 (4.7% less than US median income)
Households earning less than $10,000: 30,955 (4.50%)
Households earning over $200,000: 45,347 (6.50%)
Median earnings for workers: $34,941 (men: $51,941; women: $40,803)
Unemployment rate: 3.30%
Families with income below poverty level: 7.70%
Households with health insurance: 91.20%
 Jon Sullivan, Wikimedia Commons
27: North Dakota
Median household income: $66,519 (4.6% less than US median income)
Households earning less than $10,000: 18,213 (5.60%)
Households earning over $200,000: 19,407 (6.00%)
Median earnings for workers: $39,438 (men: $57,121; women: $45,182)
Unemployment rate: 2.90%
Families with income below poverty level: 6.30%
Households with health insurance: 92.10%
 Jonathan Schilling, CC BY-SA 4.0, Wikimedia Commons
26: Georgia
Median household income: $66,559 (4.5% less than US median income)
Households earning less than $10,000: 251,693 (6.30%)
Households earning over $200,000: 337,914 (8.40%)
Median earnings for workers: $37,512 (men: $54,422; women: $45,405)
Unemployment rate: 5.50%
Families with income below poverty level: 10.60%
Households with health insurance: 87.40%
 Chuck Koehler, CC BY 2.0, Wikimedia Commons
25: Nebraska
Median household income: $66,817 (4.2% less than US median income)
Households earning less than $10,000: 40,806 (5.20%)
Households earning over $200,000: 53,061 (6.80%)
Median earnings for workers: $38,898 (men: $56,121; women: $44,037)
Unemployment rate: 2.70%
Families with income below poverty level: 6.70%
Households with health insurance: 92.90%
Chuck Koehler, CC BY 2.0, Wikimedia Commons
24: Texas
Median household income: $66,963 (4.0% less than US median income)
Households earning less than $10,000: 657,665 (6.10%)
Households earning over $200,000: 955,952 (8.90%)
Median earnings for workers: $38,059 (men: $56,100; women: $45,393)
Unemployment rate: 6.20%
Families with income below poverty level: 11.00%
Households with health insurance: 82.00%
 Carol M. Highsmith, Wikimedia Commons
23: Wisconsin
Median household income: $67,125 (3.7% less than US median income)
Households earning less than $10,000: 117,547 (4.80%)
Households earning over $200,000: 160,477 (6.60%)
Median earnings for workers: $40,678 (men: $57,925; women: $46,762)
Unemployment rate: 3.50%
Families with income below poverty level: 6.80%
Households with health insurance: 94.60%
 Isaac Rowlett, CC BY 4.0, Wikimedia Commons
22: Pennsylvania
Median household income: $68,957 (1.1% less than US median income)
Households earning less than $10,000: 308,449 (5.90%)
Households earning over $200,000: 454,003 (8.70%)
Median earnings for workers: $40,983 (men: $62,096; women: $50,272)
Unemployment rate: 6.40%
Families with income below poverty level: 8.30%
Households with health insurance: 94.50%

21: Arizona
Median household income: $69,056 (0.9% less than US median income)
Households earning less than $10,000: 158,400 (5.60%)
Households earning over $200,000: 228,651 (8.10%)
Median earnings for workers: $39,023 (men: $55,458; women: $46,309)
Unemployment rate: 5.80%
Families with income below poverty level: 9.10%
Households with health insurance: 89.30%

20: Delaware
Median household income: $71,091 (2.0% more than US median income)
Households earning less than $10,000: 20,504 (5.20%)
Households earning over $200,000: 33,025 (8.30%)
Median earnings for workers: $41,374 (men: $60,608; women: $51,827)
Unemployment rate: 5.60%
Families with income below poverty level: 8.60%
Households with health insurance: 94.30%
 PookieFugglestein, Wikimedia Commons
19: Oregon
Median household income: $71,562 (2.6% more than US median income)
Households earning less than $10,000: 90,749 (5.30%)
Households earning over $200,000: 153,152 (9.00%)
Median earnings for workers: $40,063 (men: $60,831; women: $51,057)
Unemployment rate: 6.40%
Families with income below poverty level: 7.60%
Households with health insurance: 93.90%
 Oregon Department of Transportation, CC BY 2.0, Wikimedia Commons
18: Illinois
Median household income: $72,205 (3.6% more than US median income)
Households earning less than $10,000: 321,928 (6.40%)
Households earning over $200,000: 504,727 (10.10%)
Median earnings for workers: $41,504 (men: $63,819; women: $51,131)
Unemployment rate: 7.40%
Families with income below poverty level: 8.60%
Households with health insurance: 93.00%
 Pedro Szekely, CC BY-SA 2.0, Wikimedia Commons
17: Vermont
Median household income: $72,431 (3.9% more than US median income)
Households earning less than $10,000: 10,992 (4.10%)
Households earning over $200,000: 23,553 (8.70%)
Median earnings for workers: $40,249 (men: $55,803; women: $51,931)
Unemployment rate: 4.20%
Families with income below poverty level: 6.30%
Households with health insurance: 96.30%
 King of Hearts, CC BY-SA 4.0, Wikimedia Commons
16: Rhode Island
Median household income: $74,008 (6.2% more than US median income)
Households earning less than $10,000: 25,735 (5.80%)
Households earning over $200,000: 45,324 (10.30%)
Median earnings for workers: $41,891 (men: $63,219; women: $54,188)
Unemployment rate: 7.70%
Families with income below poverty level: 7.00%
Households with health insurance: 95.70%
 Kenneth C. Zirkel, CC BY-SA 4.0, Wikimedia Commons
15: New York
Median household income: $74,314 (6.6% more than US median income)
Households earning less than $10,000: 535,006 (7.00%)
Households earning over $200,000: 987,887 (12.90%)
Median earnings for workers: $43,462 (men: $67,512; women: $59,869)
Unemployment rate: 8.70%
Families with income below poverty level: 10.10%
Households with health insurance: 94.80%
 Ajay Suresh, CC BY 2.0, Wikimedia Commons
14: Minnesota
Median household income: $77,720 (11.5% more than US median income)
Households earning less than $10,000: 96,651 (4.20%)
Households earning over $200,000: 226,903 (9.90%)
Median earnings for workers: $43,853 (men: $64,611; women: $52,535)
Unemployment rate: 4.90%
Families with income below poverty level: 5.50%
Households with health insurance: 95.50%
 AlexiusHoratius, CC BY-SA 3.0, Wikimedia Commons
13: Alaska
Median household income: $77,845 (11.7% more than US median income)
Households earning less than $10,000: 14,625 (5.40%)
Households earning over $200,000: 27,700 (10.20%)
Median earnings for workers: $41,962 (men: $62,134; women: $55,285)
Unemployment rate: 7.00%
Families with income below poverty level: 7.10%
Households with health insurance: 88.60%
 Quintin Soloviev, CC BY-SA 4.0, Wikimedia Commons
12: Utah
Median household income: $79,449 (14.0% more than US median income)
Households earning less than $10,000: 47,612 (4.30%)
Households earning over $200,000: 108,131 (9.80%)
Median earnings for workers: $37,325 (men: $61,269; women: $44,707)
Unemployment rate: 3.50%
Families with income below poverty level: 5.90%
Households with health insurance: 91.00%
 Jkinsocal, CC BY-SA 3.0, Wikimedia Commons
11: Virginia
Median household income: $80,963 (16.1% more than US median income)
Households earning less than $10,000: 167,157 (5.00%)
Households earning over $200,000: 445,751 (13.40%)
Median earnings for workers: $43,963 (men: $66,014; women: $53,414)
Unemployment rate: 4.80%
Families with income below poverty level: 6.90%
Households with health insurance: 93.20%
 Pi.1415926535, CC BY-SA 3.0, Wikimedia Commons
10: Colorado
Median household income: $82,254 (18.0% more than US median income)
Households earning less than $10,000: 110,592 (4.80%)
Households earning over $200,000: 277,905 (12.00%)
Median earnings for workers: $44,818 (men: $65,217; women: $54,635)
Unemployment rate: 5.30%
Families with income below poverty level: 6.20%
Households with health insurance: 92.00%
 Trueshow111, Wikimedia Commons
9: Connecticut
Median household income: $83,771 (20.2% more than US median income)
Households earning less than $10,000: 74,573 (5.20%)
Households earning over $200,000: 208,195 (14.60%)
Median earnings for workers: $45,511 (men: $73,022; women: $60,672)
Unemployment rate: 6.70%
Families with income below poverty level: 6.70%
Households with health insurance: 94.80%
 John9474, CC BY-SA 4.0, Wikimedia Commons
8: Washington
Median household income: $84,247 (20.8% more than US median income)
Households earning less than $10,000: 145,555 (4.80%)
Households earning over $200,000: 422,689 (14.00%)
Median earnings for workers: $46,951 (men: $74,068; women: $57,567)
Unemployment rate: 5.90%
Families with income below poverty level: 6.50%
Households with health insurance: 93.60%
 Daniel Schwen, CC BY-SA 4.0, Wikimedia Commons
7: Hawaii
Median household income: $84,857 (21.7% more than US median income)
Households earning less than $10,000: 26,535 (5.40%)
Households earning over $200,000: 65,102 (13.30%)
Median earnings for workers: $40,595 (men: $61,812; women: $49,816)
Unemployment rate: 7.70%
Families with income below poverty level: 8.00%
Households with health insurance: 96.10%
 ArdentArbitration, Wikimedia Commons
6: California
Median household income: $84,907 (21.8% more than US median income)
Households earning less than $10,000: 715,644 (5.30%)
Households earning over $200,000: 2,082,043 (15.50%)
Median earnings for workers: $41,891 (men: $65,324; women: $57,373)
Unemployment rate: 8.30%
Families with income below poverty level: 9.00%
Households with health insurance: 93.00%
 Noah Friedlander, CC BY-SA 4.0, Wikimedia Commons
5: New Hampshire
Median household income: $88,465 (26.9% more than US median income)
Households earning less than $10,000: 17,235 (3.10%)
Households earning over $200,000: 62,138 (11.30%)
Median earnings for workers: $45,677 (men: $68,566; women: $51,880)
Unemployment rate: 3.60%
Families with income below poverty level: 4.80%
Households with health insurance: 94.90%
 Mikespenard, Wikimedia Commons
4: New Jersey
Median household income: $89,296 (28.1% more than US median income)
Households earning less than $10,000: 171,737 (4.90%)
Households earning over $200,000: 584,370 (16.70%)
Median earnings for workers: $50,021 (men: $75,297; women: $61,802)
Unemployment rate: 8.10%
Families with income below poverty level: 7.40%
Households with health insurance: 92.80%
 BJT11091, CC BY-SA 3.0, Wikimedia Commons
3: Massachusetts
Median household income: $89,645 (28.6% more than US median income)
Households earning less than $10,000: 149,006 (5.40%)
Households earning over $200,000: 472,304 (17.10%)
Median earnings for workers: $50,683 (men: $77,636; women: $66,536)
Unemployment rate: 6.60%
Families with income below poverty level: 7.10%
Households with health insurance: 97.50%
 Terageorge, CC BY-SA 3.0, Wikimedia Commons
2: Washington DC
Median household income: $90,088 (29.2% more than US median income)
Households earning less than $10,000: 30,677 (9.60%)
Households earning over $200,000: 68,951 (21.60%)
Median earnings for workers: $72,457 (men: $103,222; women: $87,244)
Unemployment rate: 8.20%
Families with income below poverty level: 12.80%
Households with health insurance: 96.30%
 David, CC BY 2.0, Wikimedia Commons
1: Maryland
Median household income: $90,203 (29.4% more than US median income)
Households earning less than $10,000: 122,990 (5.20%)
Households earning over $200,000: 355,084 (15.10%)
Median earnings for workers: $50,548 (men: $71,995; women: $62,190)
Unemployment rate: 5.90%
Families with income below poverty level: 7.40%
Households with health insurance: 93.90%
You might also like:
The 10 Best States To Live Off-Grid—And 5 Of The Worst
Ranking The States From Worst To Best—According To Data
East Coast Americans Vs. West Coast Americans
 Powerhawk5k, Wikimedia Commons
Sources: 1


.jpg)
.jpg)
.jpg)
.jpg)
.jpg)
.jpg)
.jpg)
.jpg)